Color Code
Color Code for Droplets
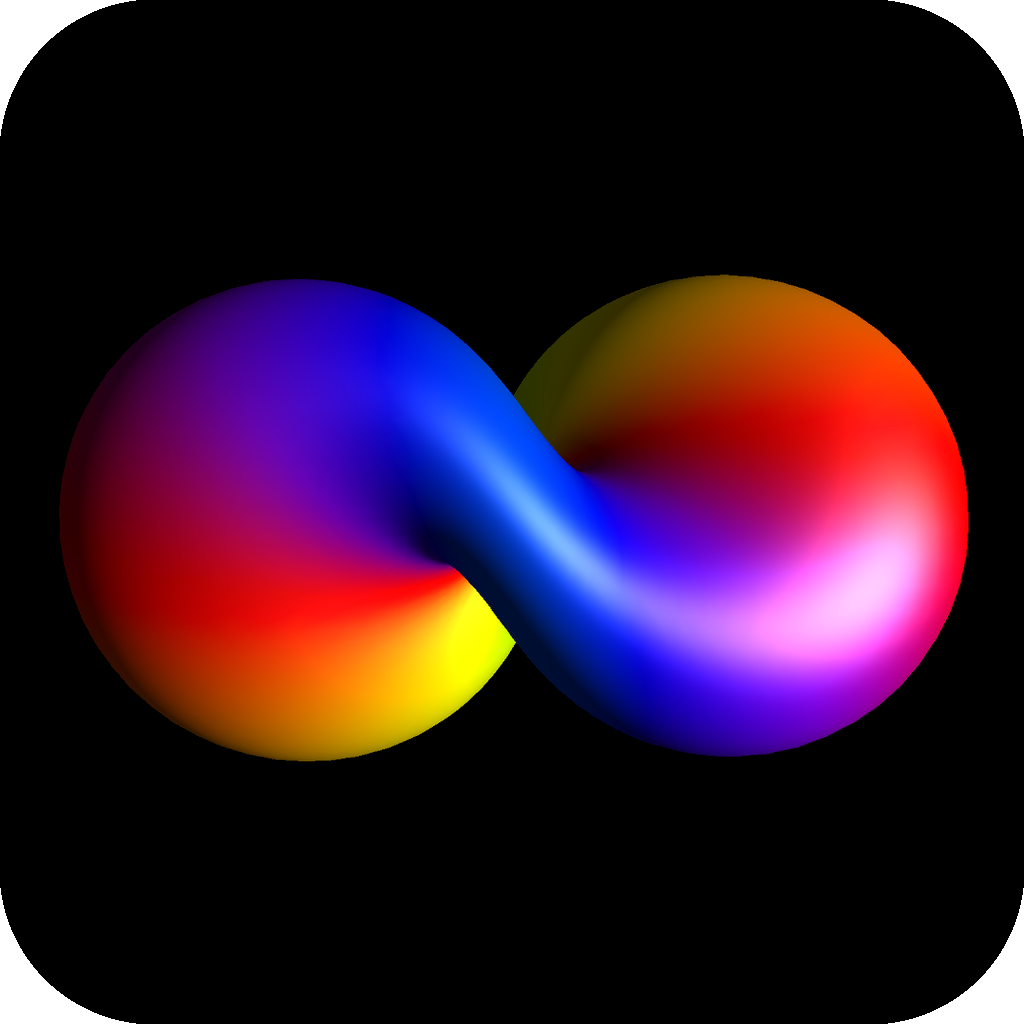
Each droplet represents a complex function on a sphere (for more details, see Mathematical Background). A complex number \(c\) can be expressed in the form \(c=r \cdot exp(iφ)\), where \(r\) is the absolute value (represented by the distance from the origin), \(φ\) is the phase, and \(exp(iφ)\) is the phase factor of the complex number (represented by the color wheel shown below). The examples here show the colors of a spherical droplet (\(r=1\)) with phase factors (\(exp(iφ)\)) of \(1\) (red), \(i\) (yellow), \(-1\) (green) and \(-i\) (blue).
φ [deg] |
φ [rad] |
exp(iφ) |
Color |
Droplet Example |
|---|---|---|---|---|
0° |
0 |
\(1\) |
Red |
|
90° |
\(\pi/2\) |
\(i\) |
Yellow |
|
180° |
\(\pi\) |
\(-1\) |
Green |
|
270° |
\(3\pi/2\) |
\(-i\) |
Blue |
|


Color Wheel
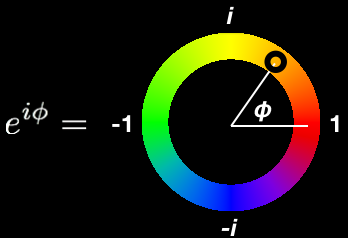
The standard color wheel used to represent the phase factor \(exp(iφ)\):
Note
This color wheel is slightly different from the one used in [GARON2015], where \(φ=π\) is cyan, rather than green. Opposing colors are used for phase factors with opposite signs: Red and green correspond to phase factors of \(1\) and \(-1\), whereas yellow and blue correspond to the phase factors \(i\) and \(-i\), respectively.
Note
We are aware of the relatively high prevalence of red-green color blindness and have already experimented with some alternative color wheels, but alas our team lacks the wetware necessary to evaluate them. Please contact us at help@spindrops.org if you are interested in helping us evaluate alternatives.
Color Code for Vectors

Fig. 161 \(I_{1}^{+}\)
Linear Cartesian spin operators, such as \(I_{1x}\), \(I_{1y}\) or \(I_{1z}\) are Hermitian and can always be represented as three-dimensional real vectors. If linear Cartesian spin operators are multiplied by \(i\), the resulting operators \(i I_{1x}\), \(i I_{1y}\) or \(i I_{1z}\) are skew-Hermitian, which can be represented by three-dimensional imaginary vectors.
Real vectors are represented by red arrows and imaginary vectors are represented by yellow arrows. This is illustrated in Fig. 161 for the example of the raising operator \(I_{1}^{+} = I_{1x} + i I_{1y}\): the term \(I_{1x}\) is represented by a real vector pointing along the x axis (red arrow), and the term \(i I_{1y}\) is represented by an imaginary vector pointing along the y axis (yellow arrow). Next to the arrows, the axes indicator is also drawn, the X and Y axis indicators are drawn using their color as relative to their positional orientation around the Z axis. The axis coloring is different from the coloring of the Bloch vectors. The color of the Bloch vectors indicates the phase of the underlying function, which in full generality can only be a linear combination of a real and imaginary vector, whereas the colors of the Axes indicator correspond to their 3D phase orientation in the x-y plane.
Color Code for Pulses
The same color code is used to represent the phase of pulses in the graphical representation of a pulse sequence:
Todo
pulse examples
Pulse Phase |
Pulse Color |
Pulse Example |
||
[Cartesian] |
[deg] |
[rad] |
||
x |
0° |
0 |
Red |
|
y |
90° |
π/2 |
Yellow |
|
-x |
180° |
π |
Green |
|
-y |
270° |
3π/2 |
Blue |
|
Rotations around the z-axis and periods of isotropic mixing are indicated by gray rectangles:

Fig. 162 Isotropic Mixing Sequence